ESG Investment
1
Financial markets continue to expand their use of ESG considerations.
- Global ESG Investment
-
Investors are actively incorporating ESG considerations into their investment decisions.
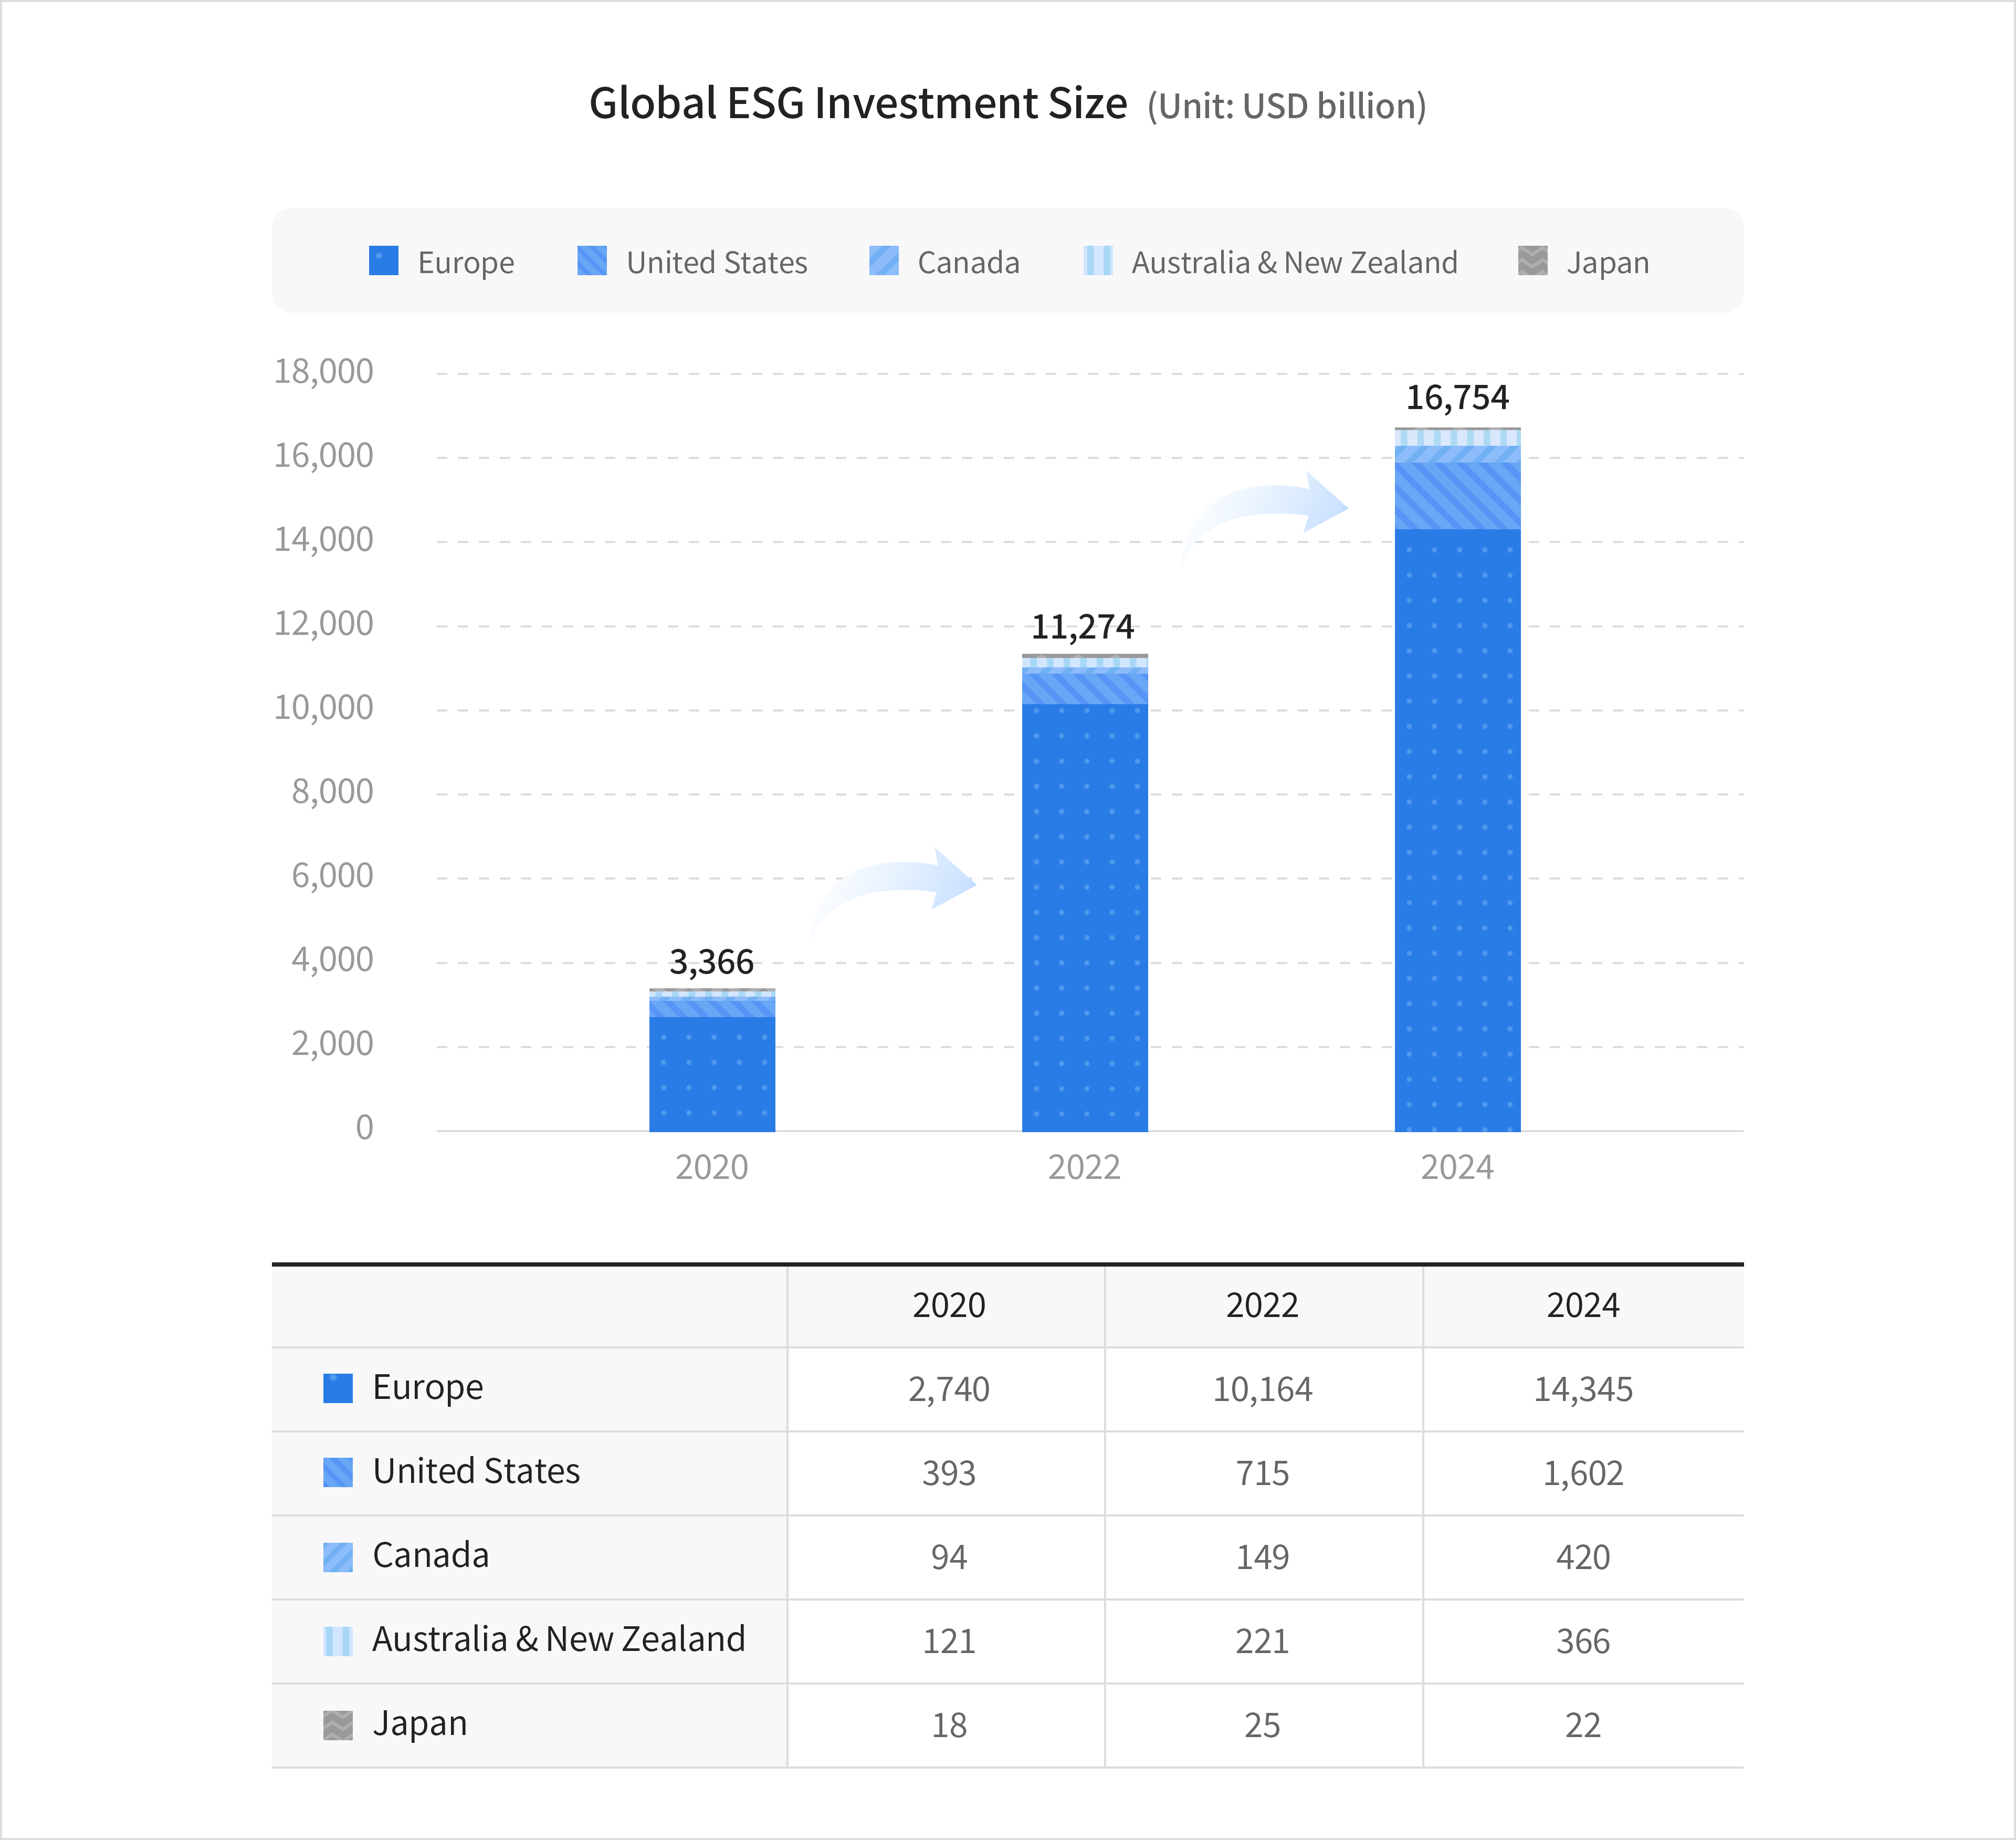
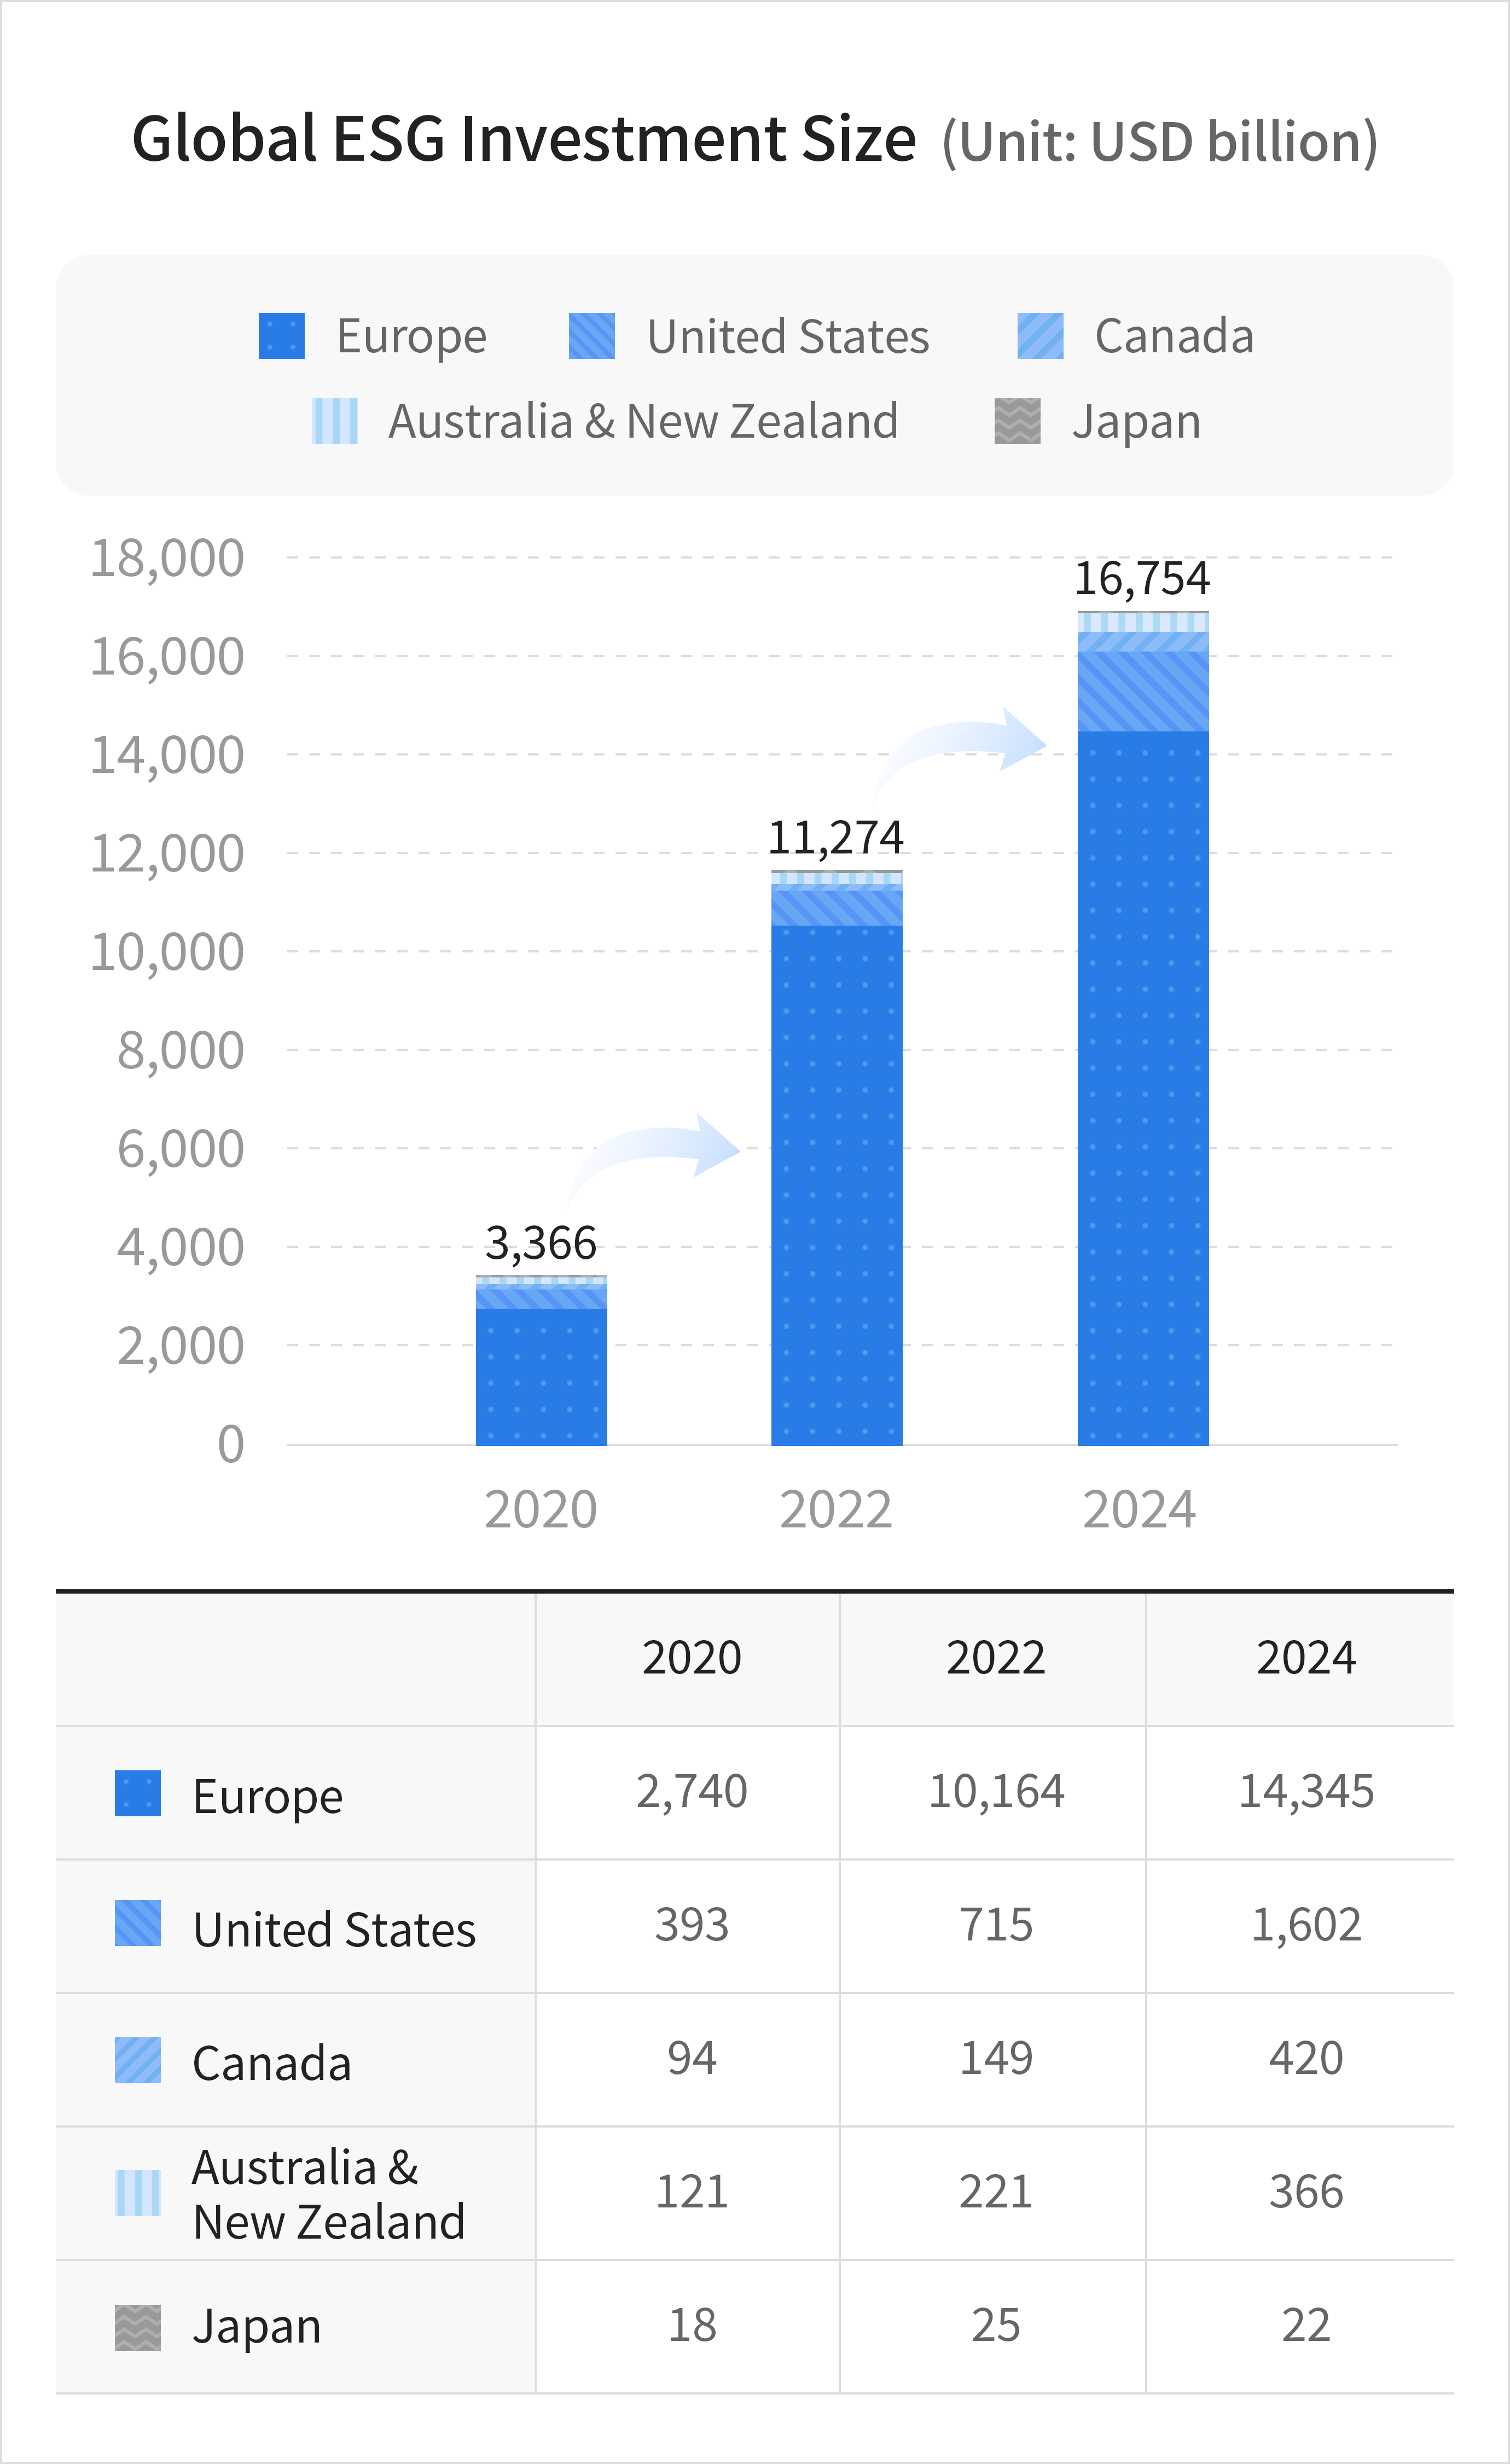 Source: Morningstar, adapted by GSIA
 - ESG Investment Approach
-
According to the Global Sustainable Investment Alliance (GSIA), ESG Investing is categorized into the following seven strategies.
Approach Definition Norms-based Screening Screening businesses or companies against minimum standards based on international norms such as those issued by the UN, OECD, or NGOs Negative/Exclusionary Screening Excluding certain businesses or companies from a portfolio based on defined criteria (e.g., weapons, tobacco, animal testing) Positive/Best in Class Screening Investing in businesses or companies that demonstrate superior ESG performance ESG integration Continuously considering ESG factors in investment analysis and decision-making to improve risk-adjusted returns Themed Investing Investing in themes or assets that contribute to environmental or social solutions (e.g., clean energy, green technology) Stewardship Using investor rights and influence to enhance long-term value for clients and beneficiaries Impact Investing Investing with the intention to generate positive, measurable social and environmental impact alongside a financial return Source: GSIA
 Source: Morningstar, adapted by GSIA
 - Domestic ESG Investment
-
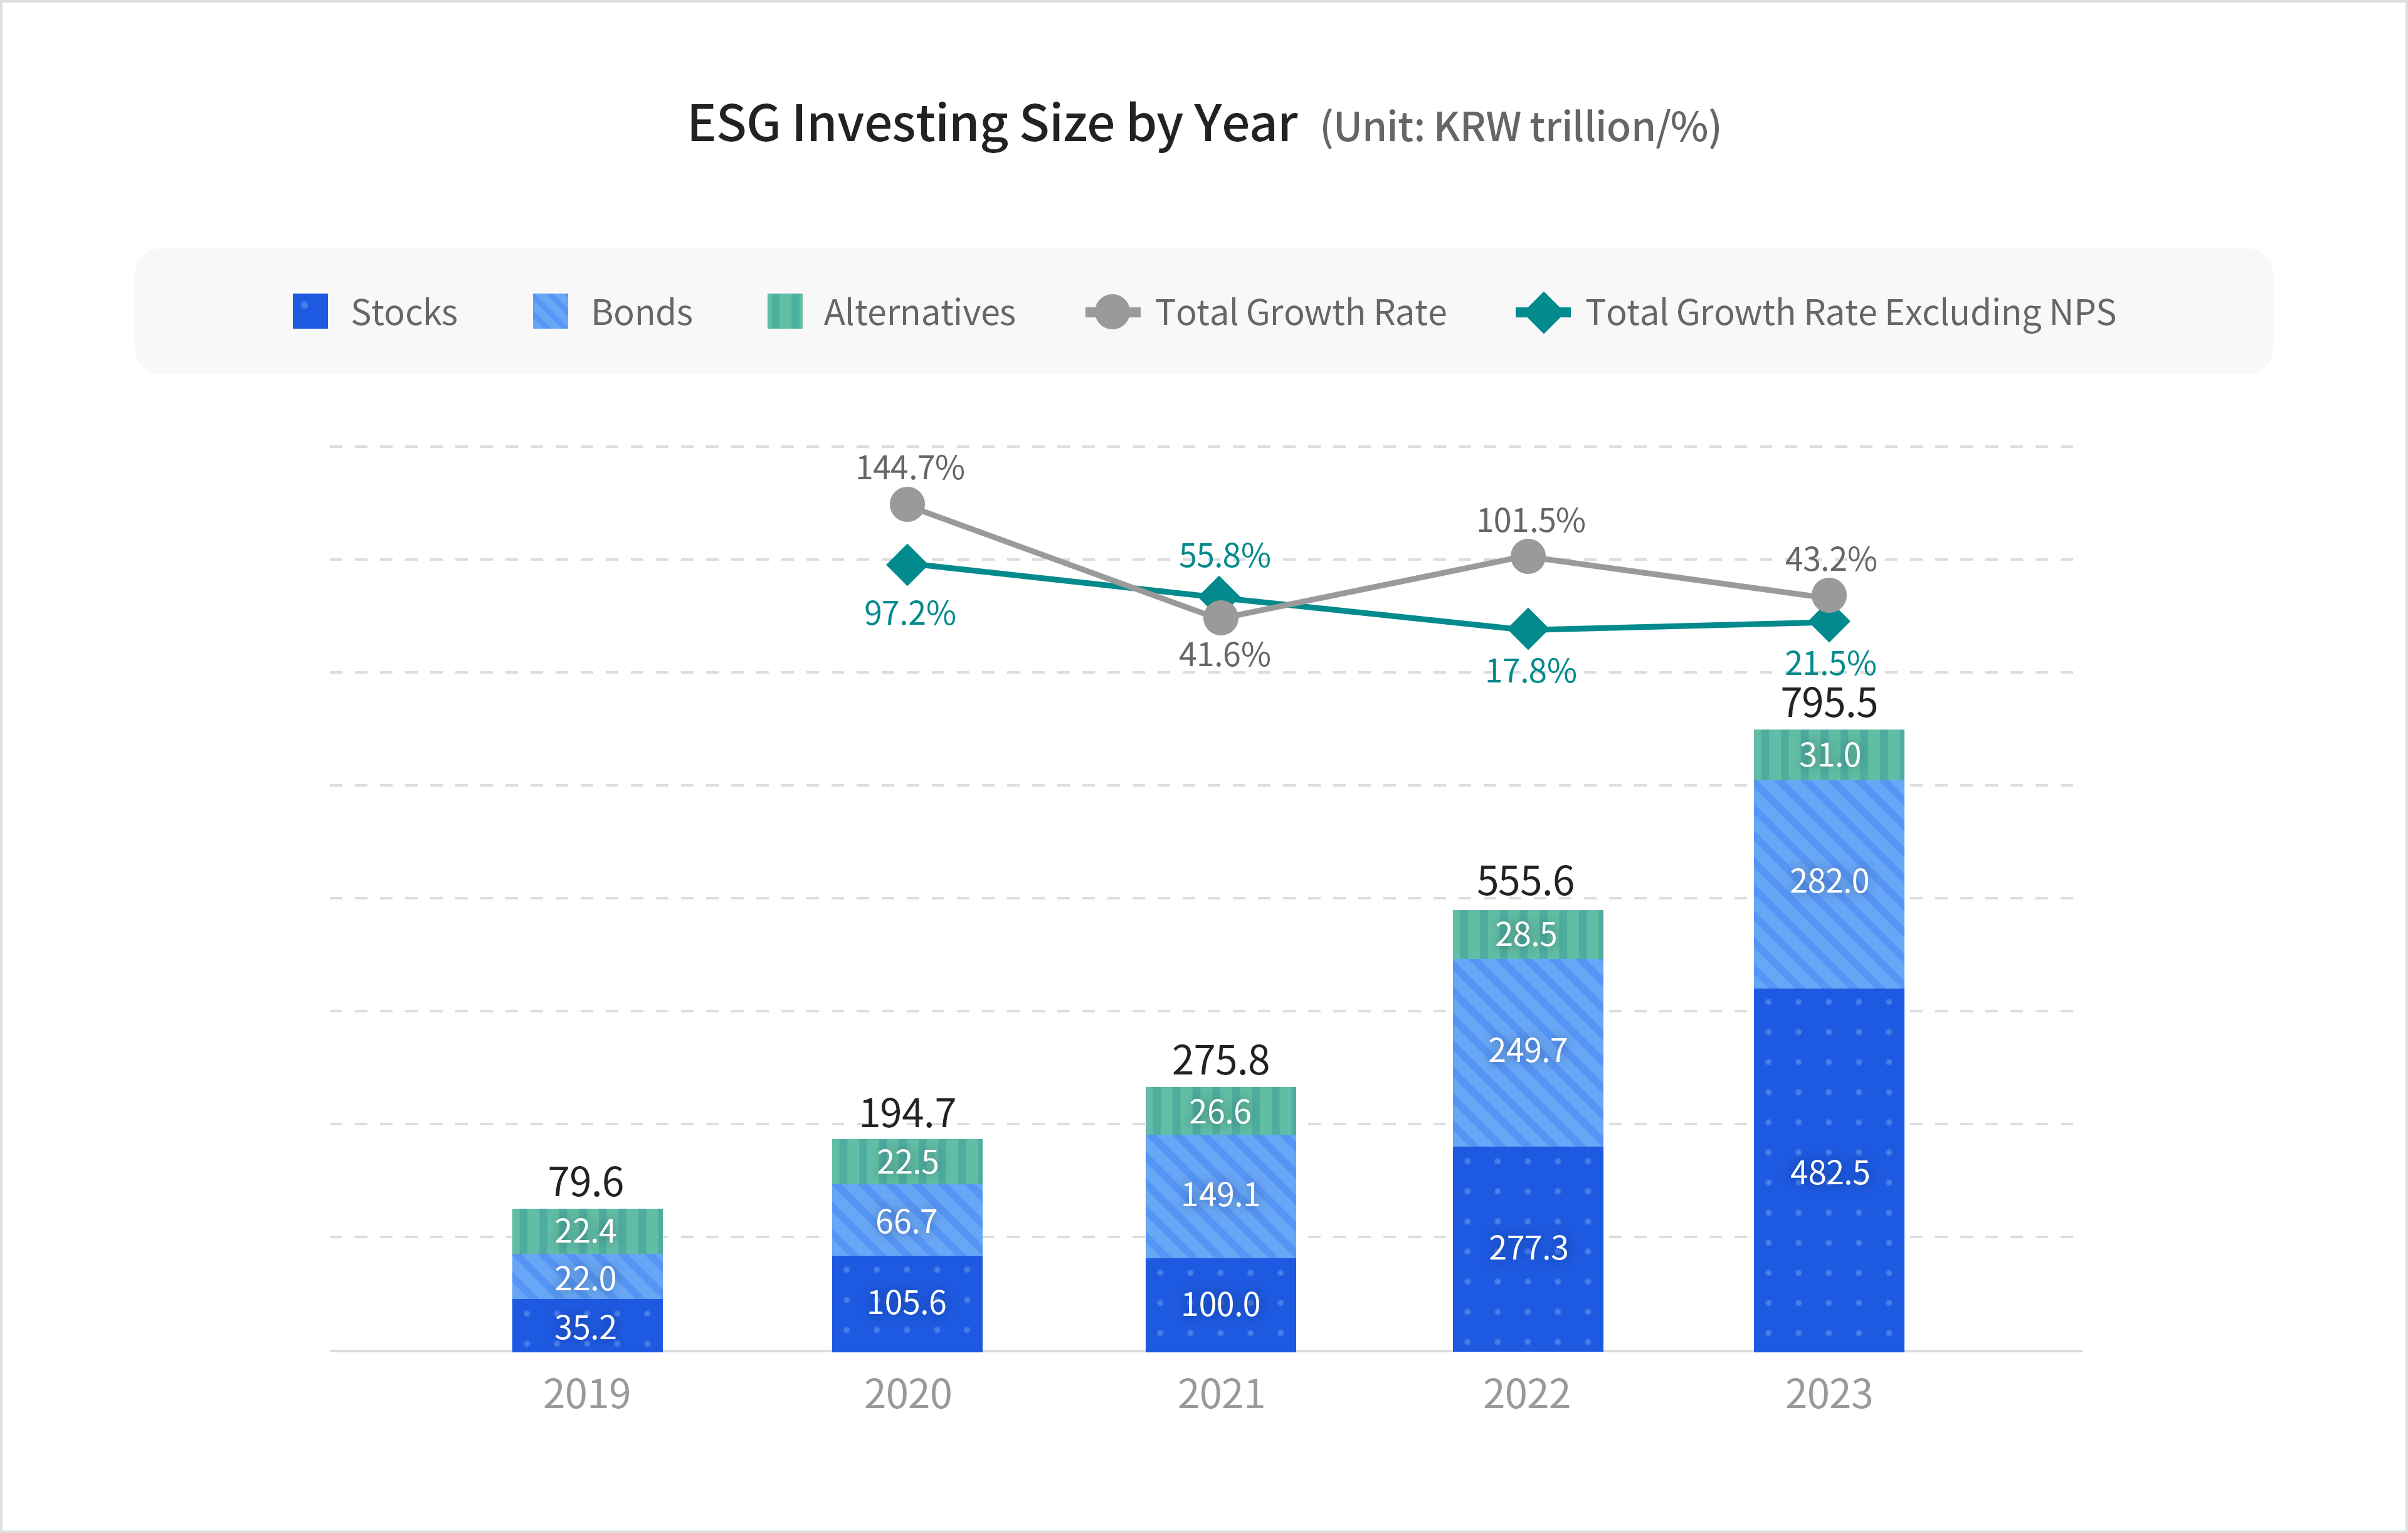
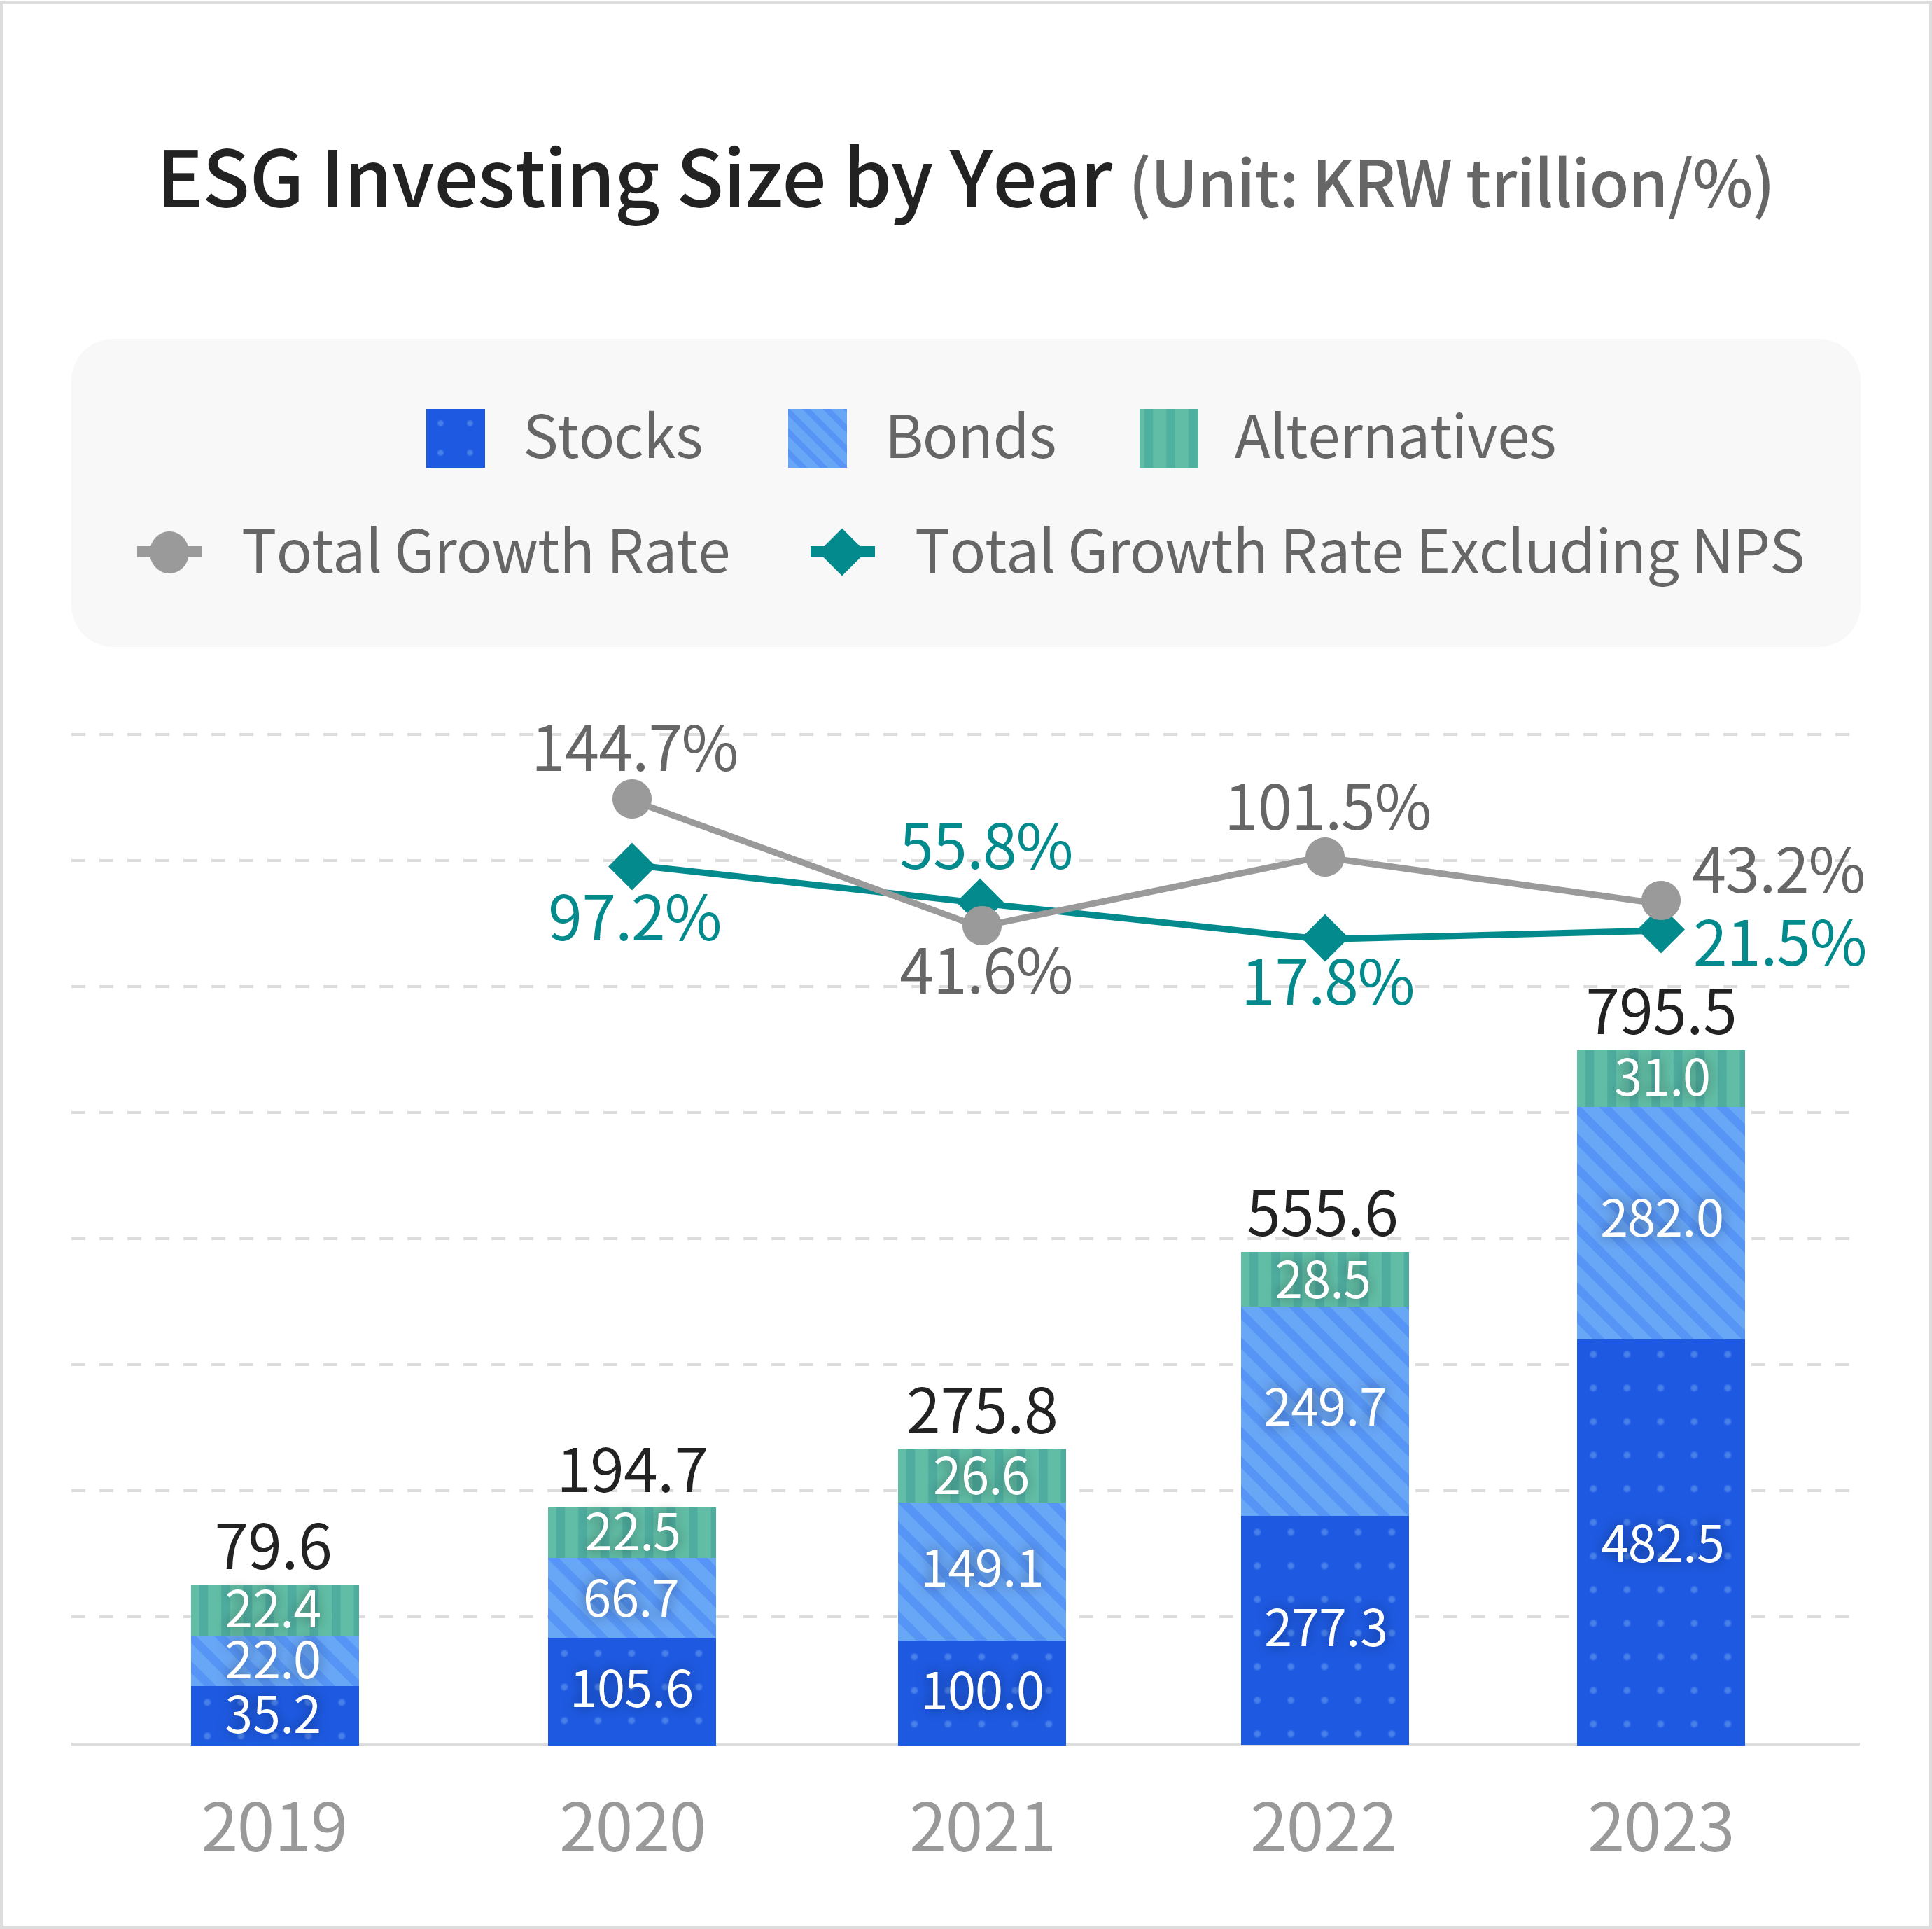
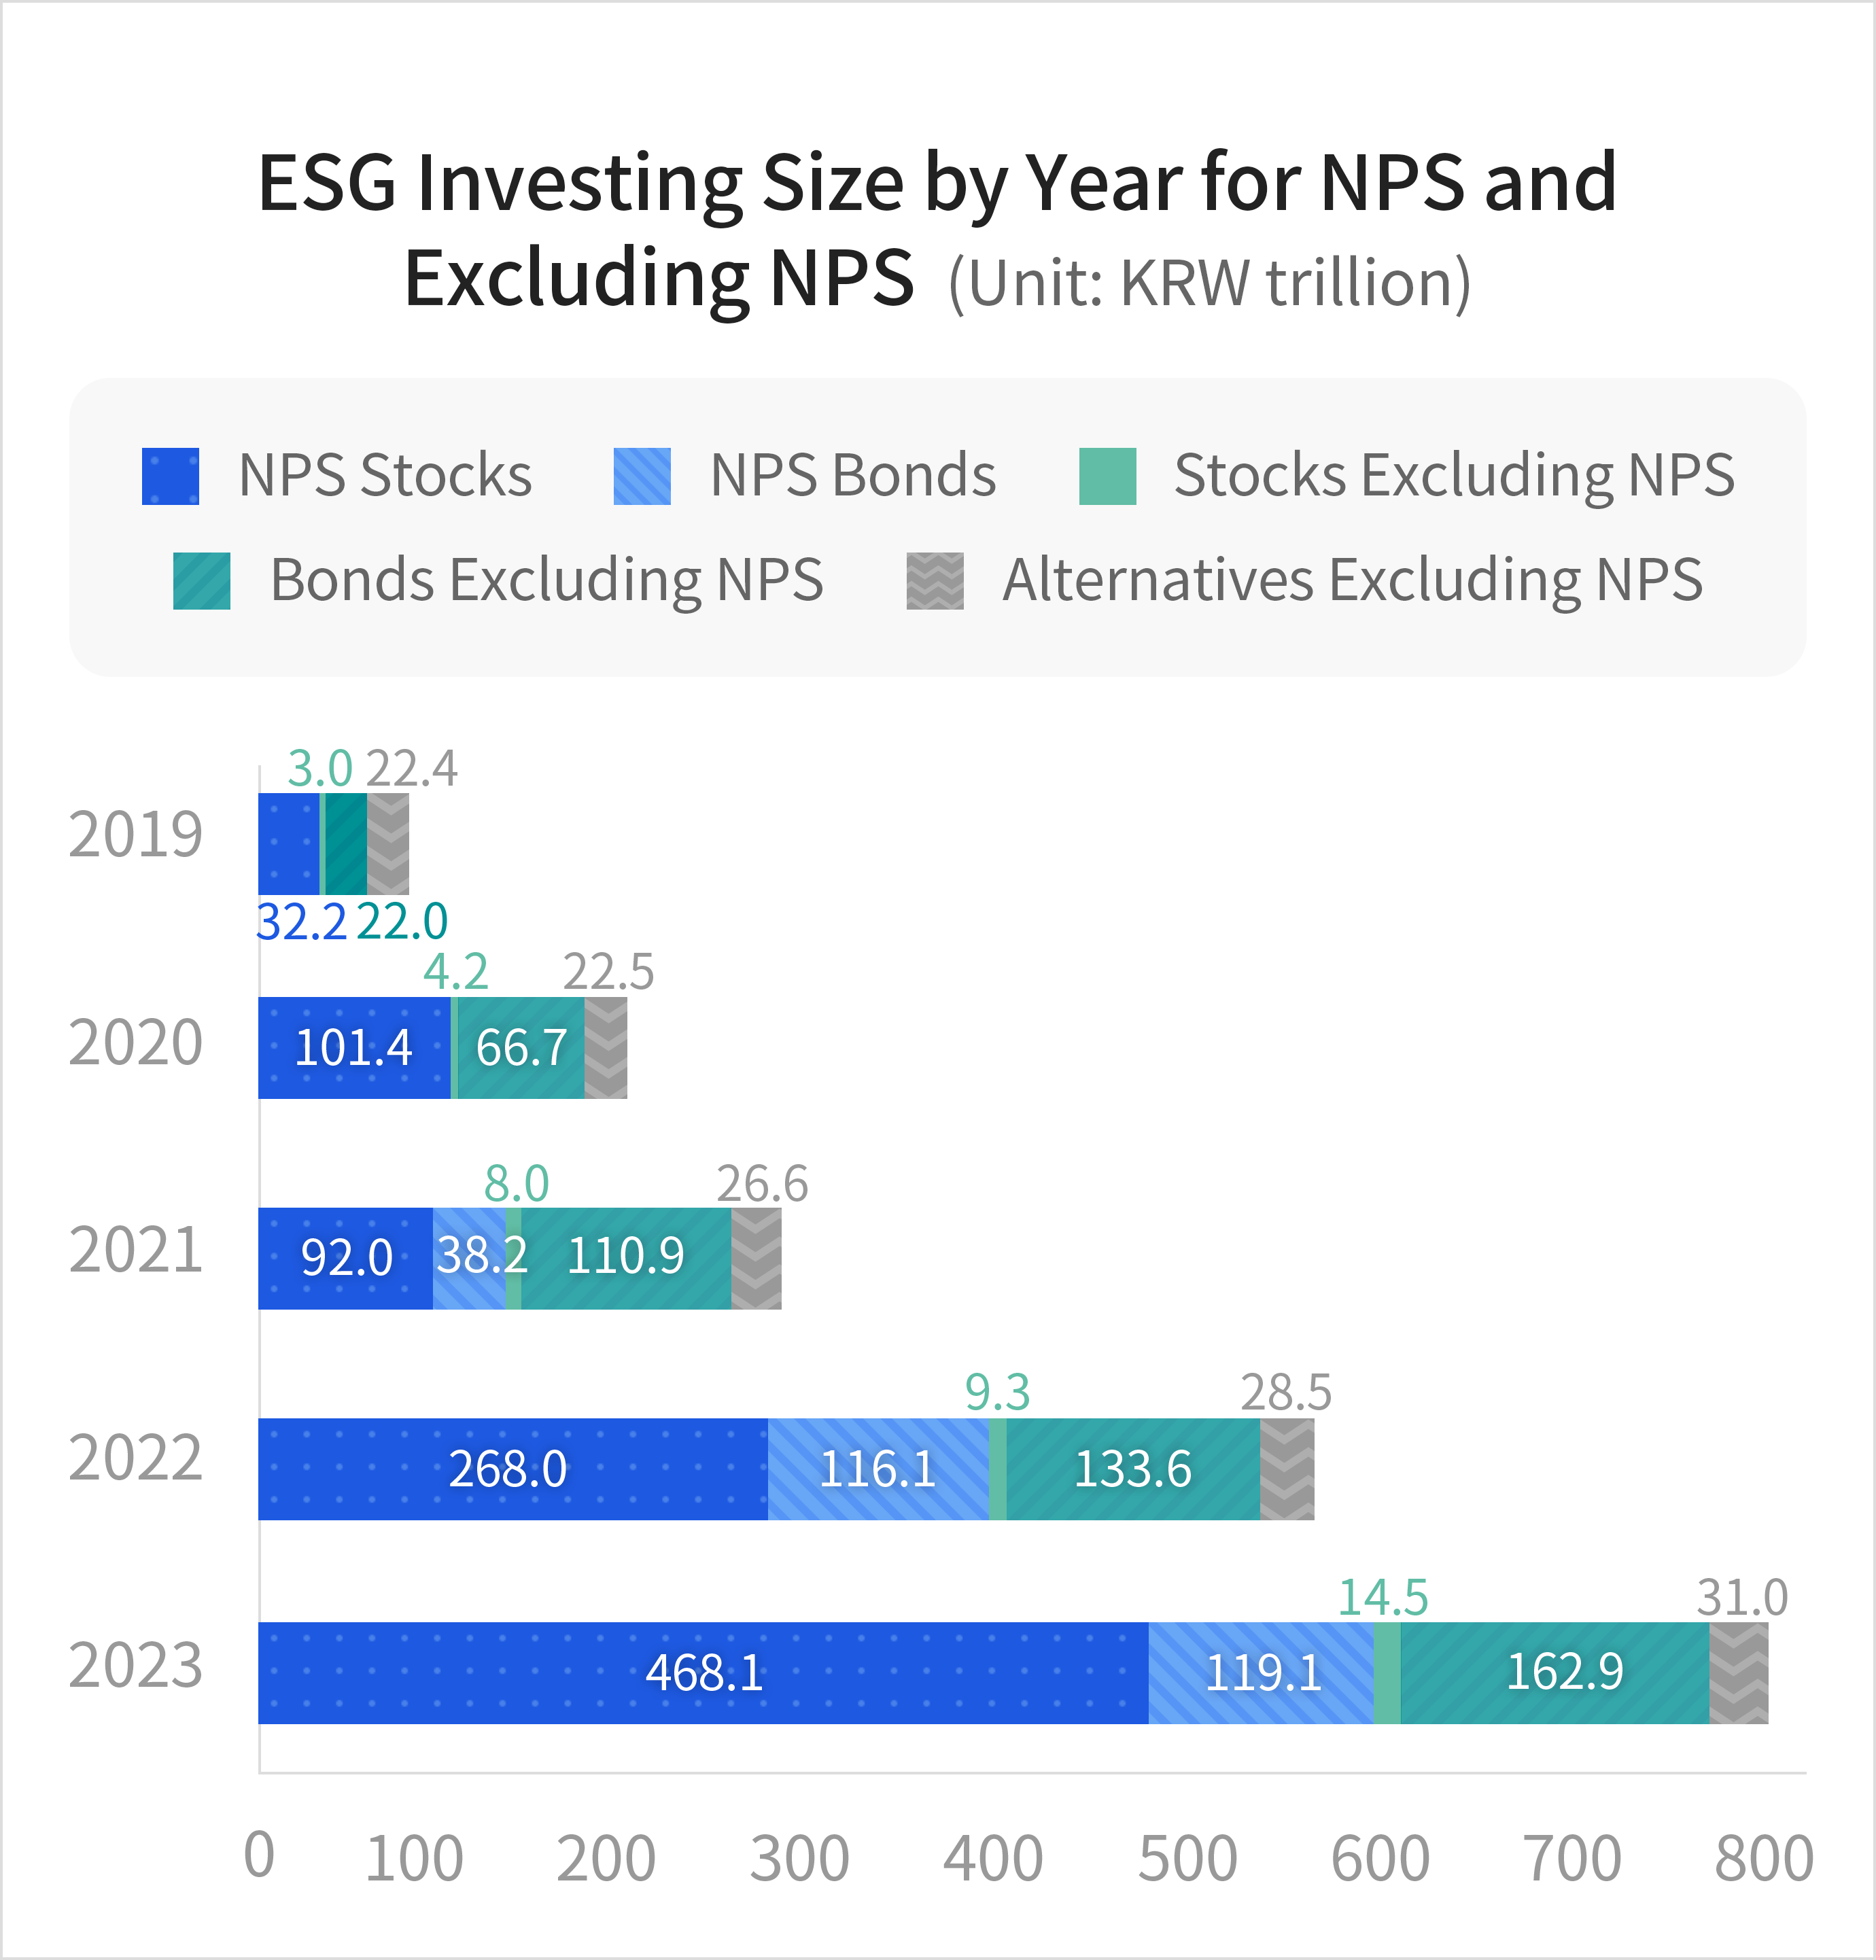
As of 2023, ESG investments by domestic financial institutions totaled KRW 795.5 trillion, marking a 43.2% increase from the previous year. This strong growth was primarily driven by the National Pension Service (NPS), which accounts for 73.8% of all ESG investments.Excluding the NPS(National Pension Service), ESG investments reached KRW 208.4 trillion, up 21.5% year on year. This increase is largely attributed to the government’s initiative to promote the ESG bond market by providing interest rate incentives for green bonds, which has stimulated ESG bond investments across the financial sector.
 Source: KoSIF(Korea Sustainability Investing Forum), Representative Byeong-deok Min's office
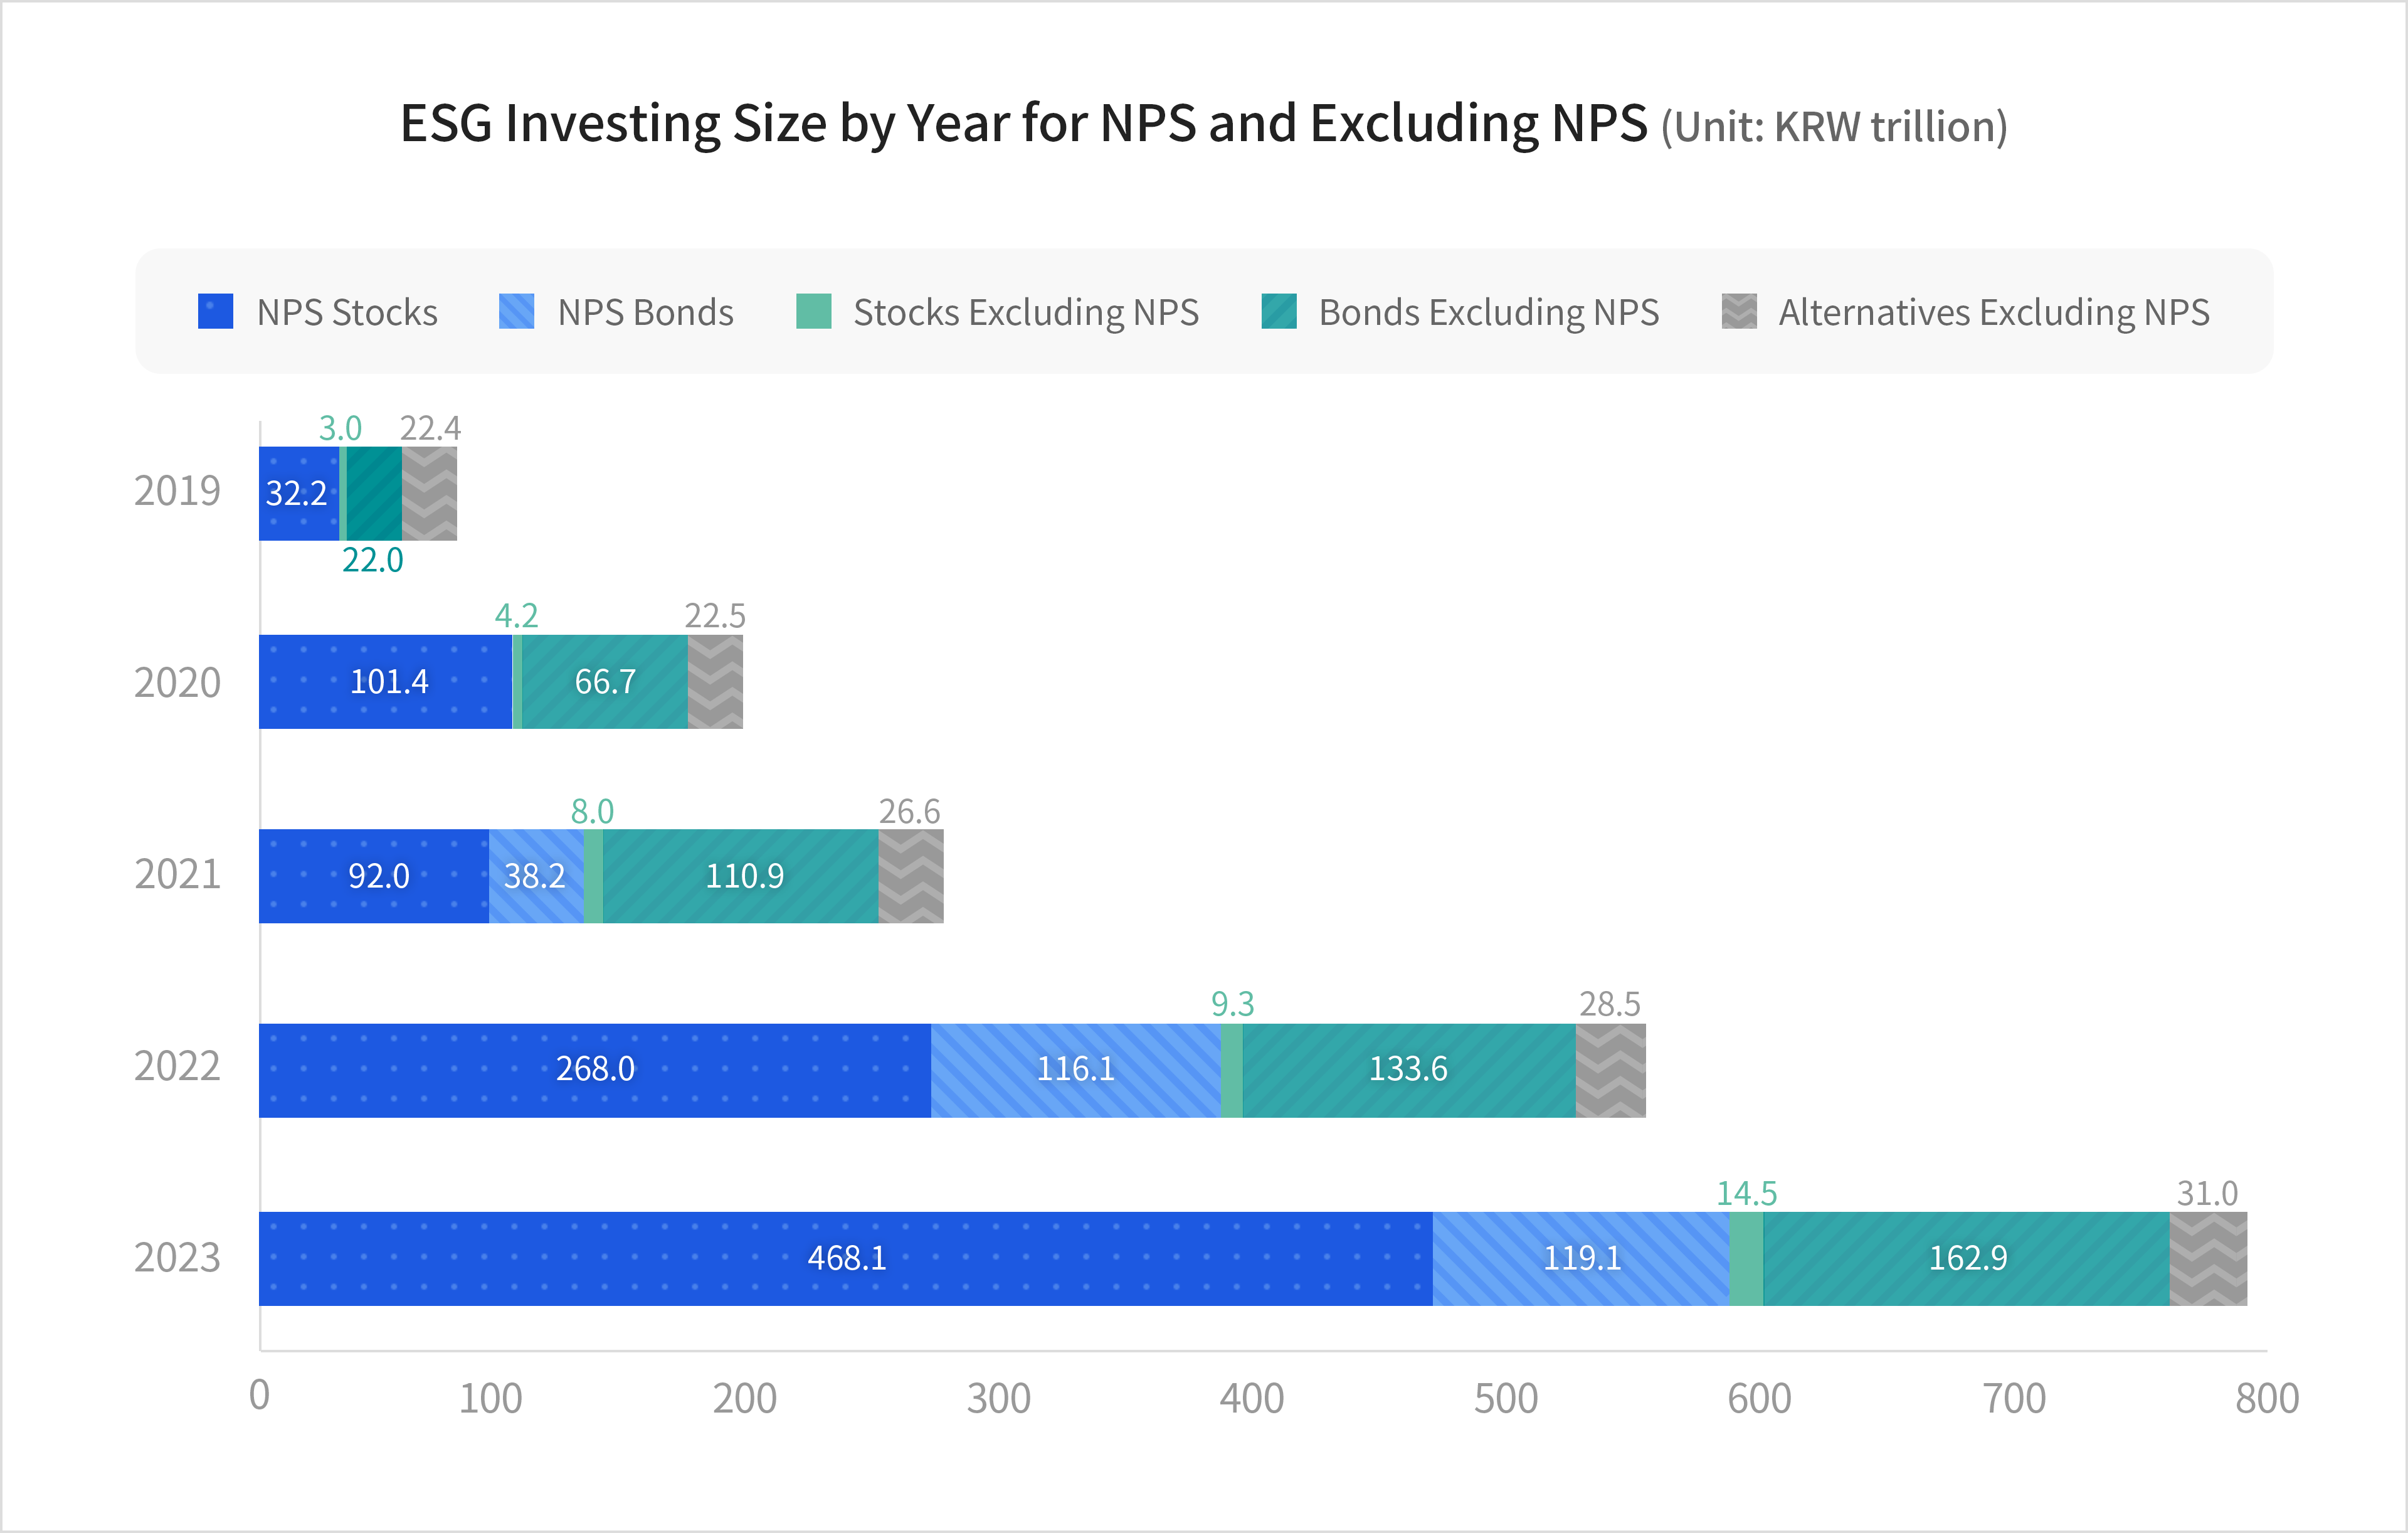
 Source: KoSIF(Korea Sustainability Investing Forum), Representative Byeong-deok Min's office
 - NPS’s ESG Investing
-
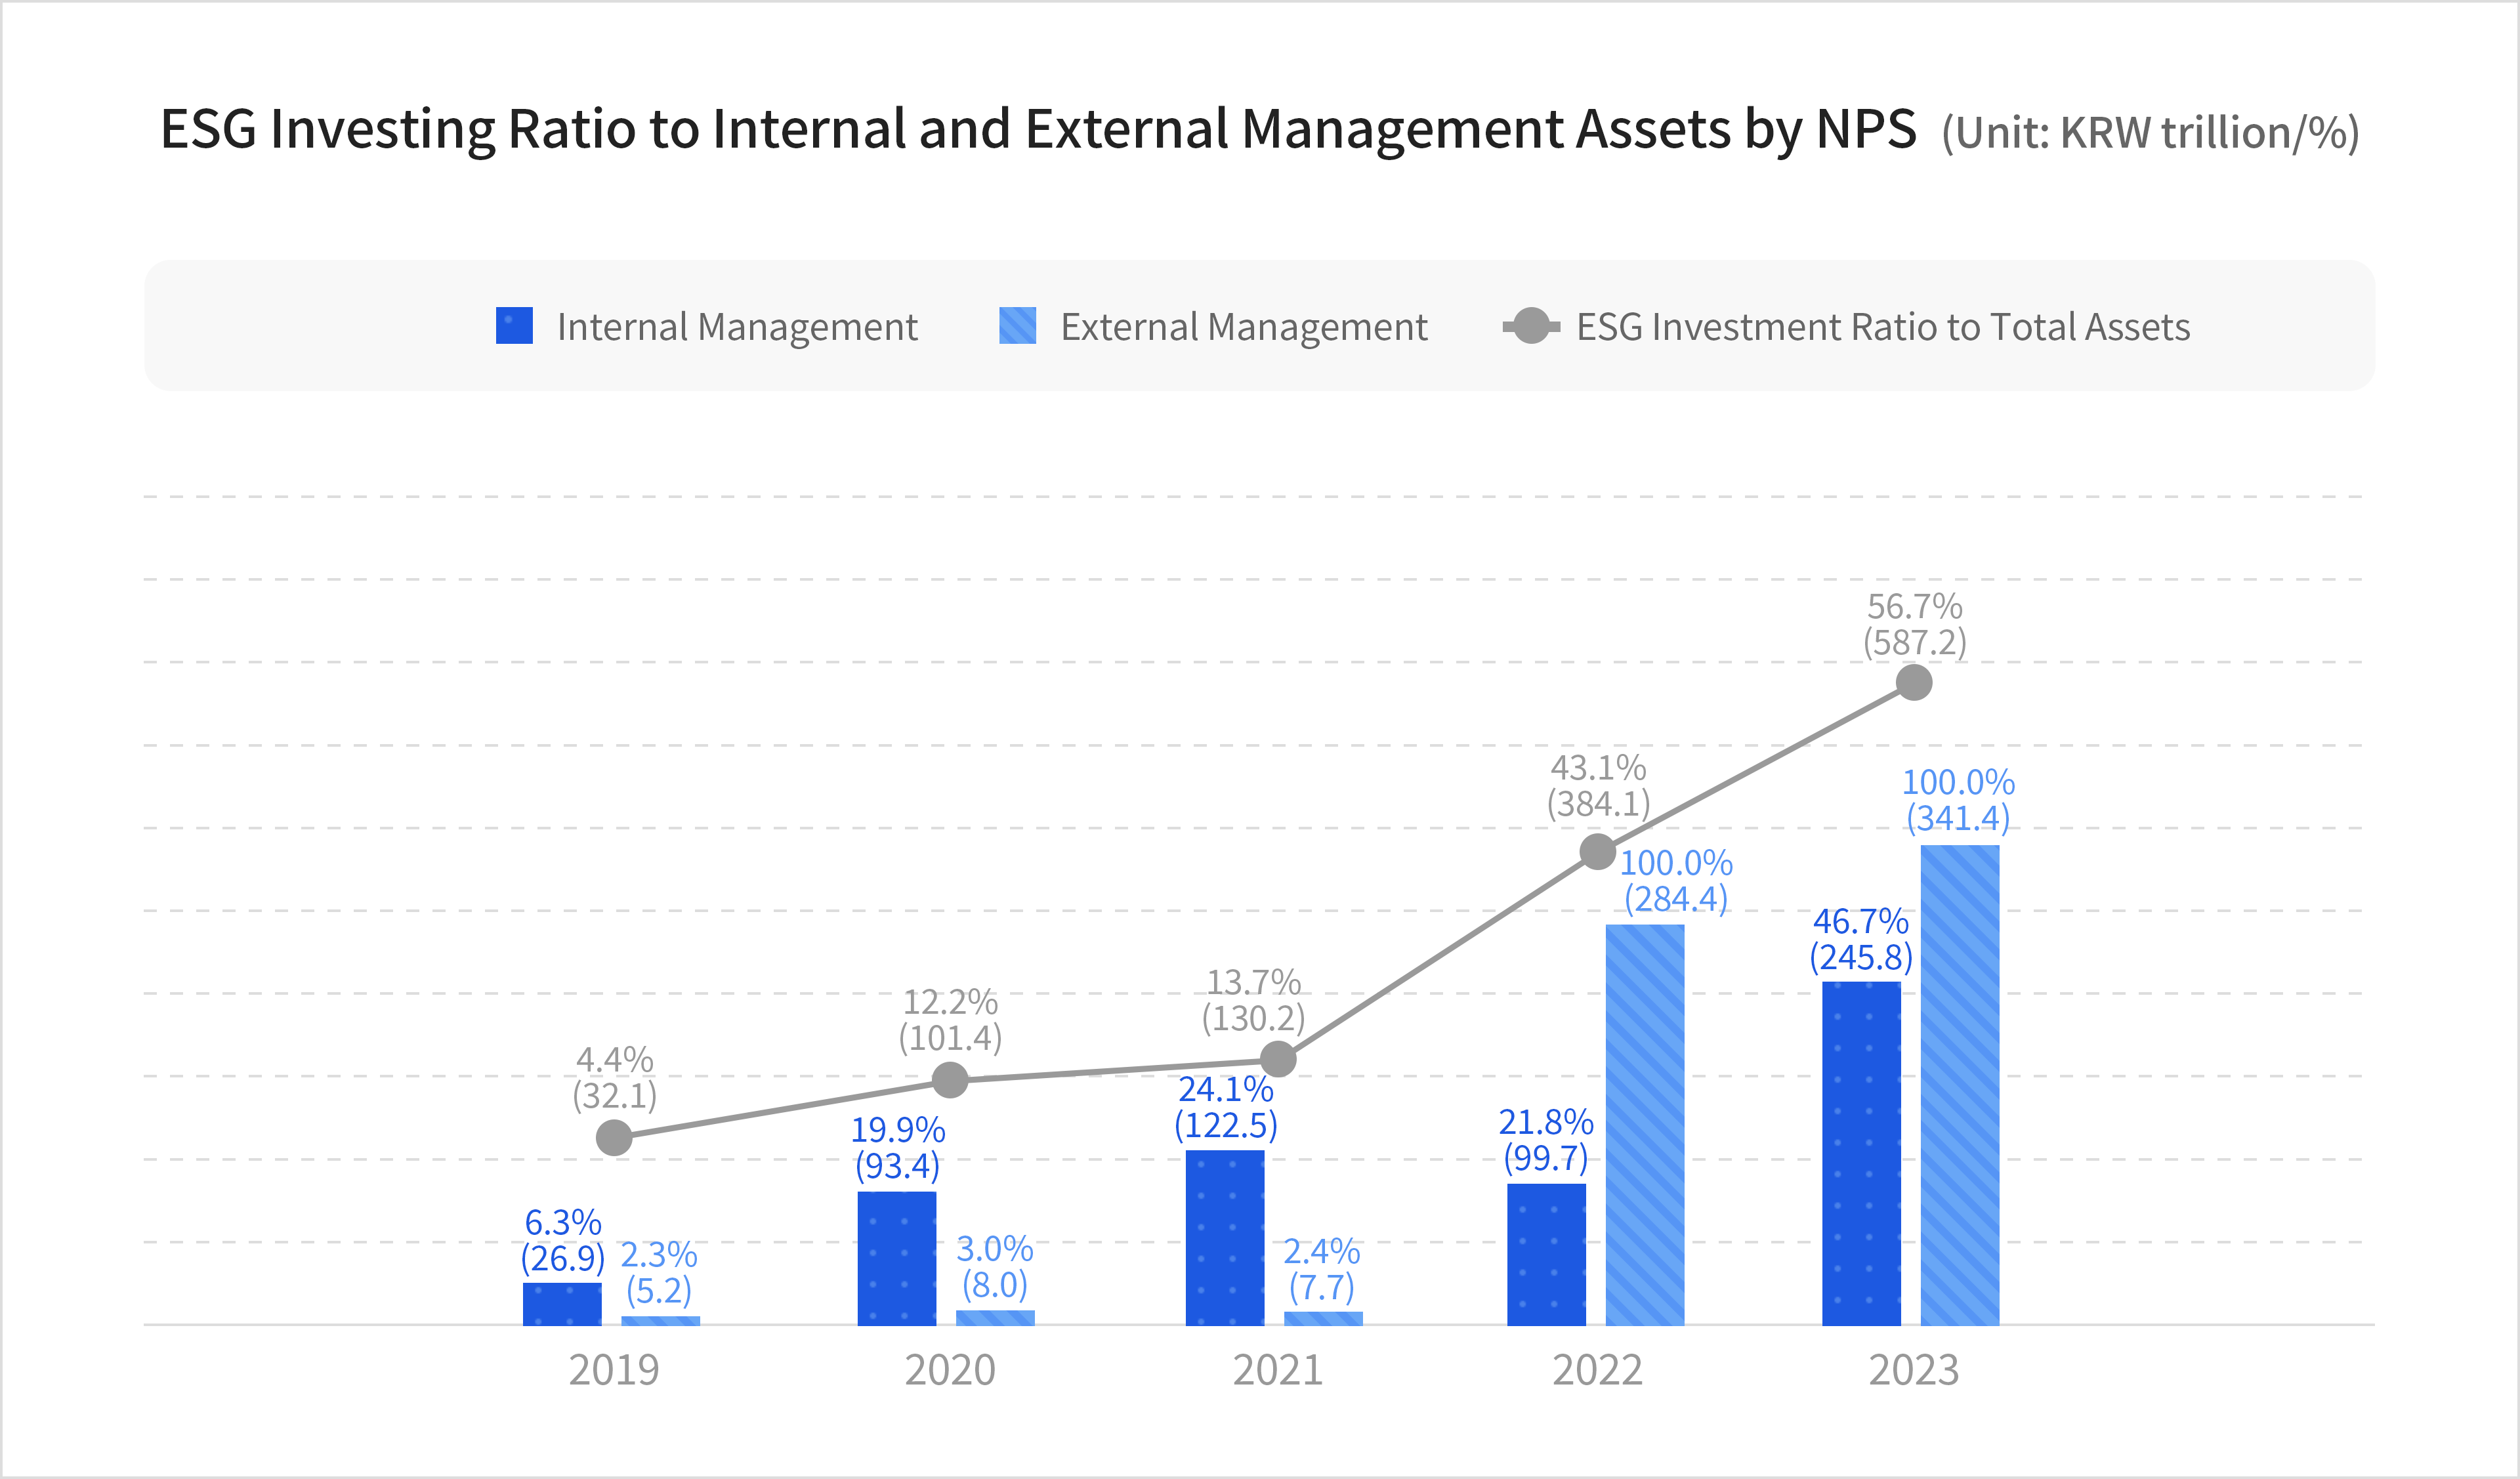
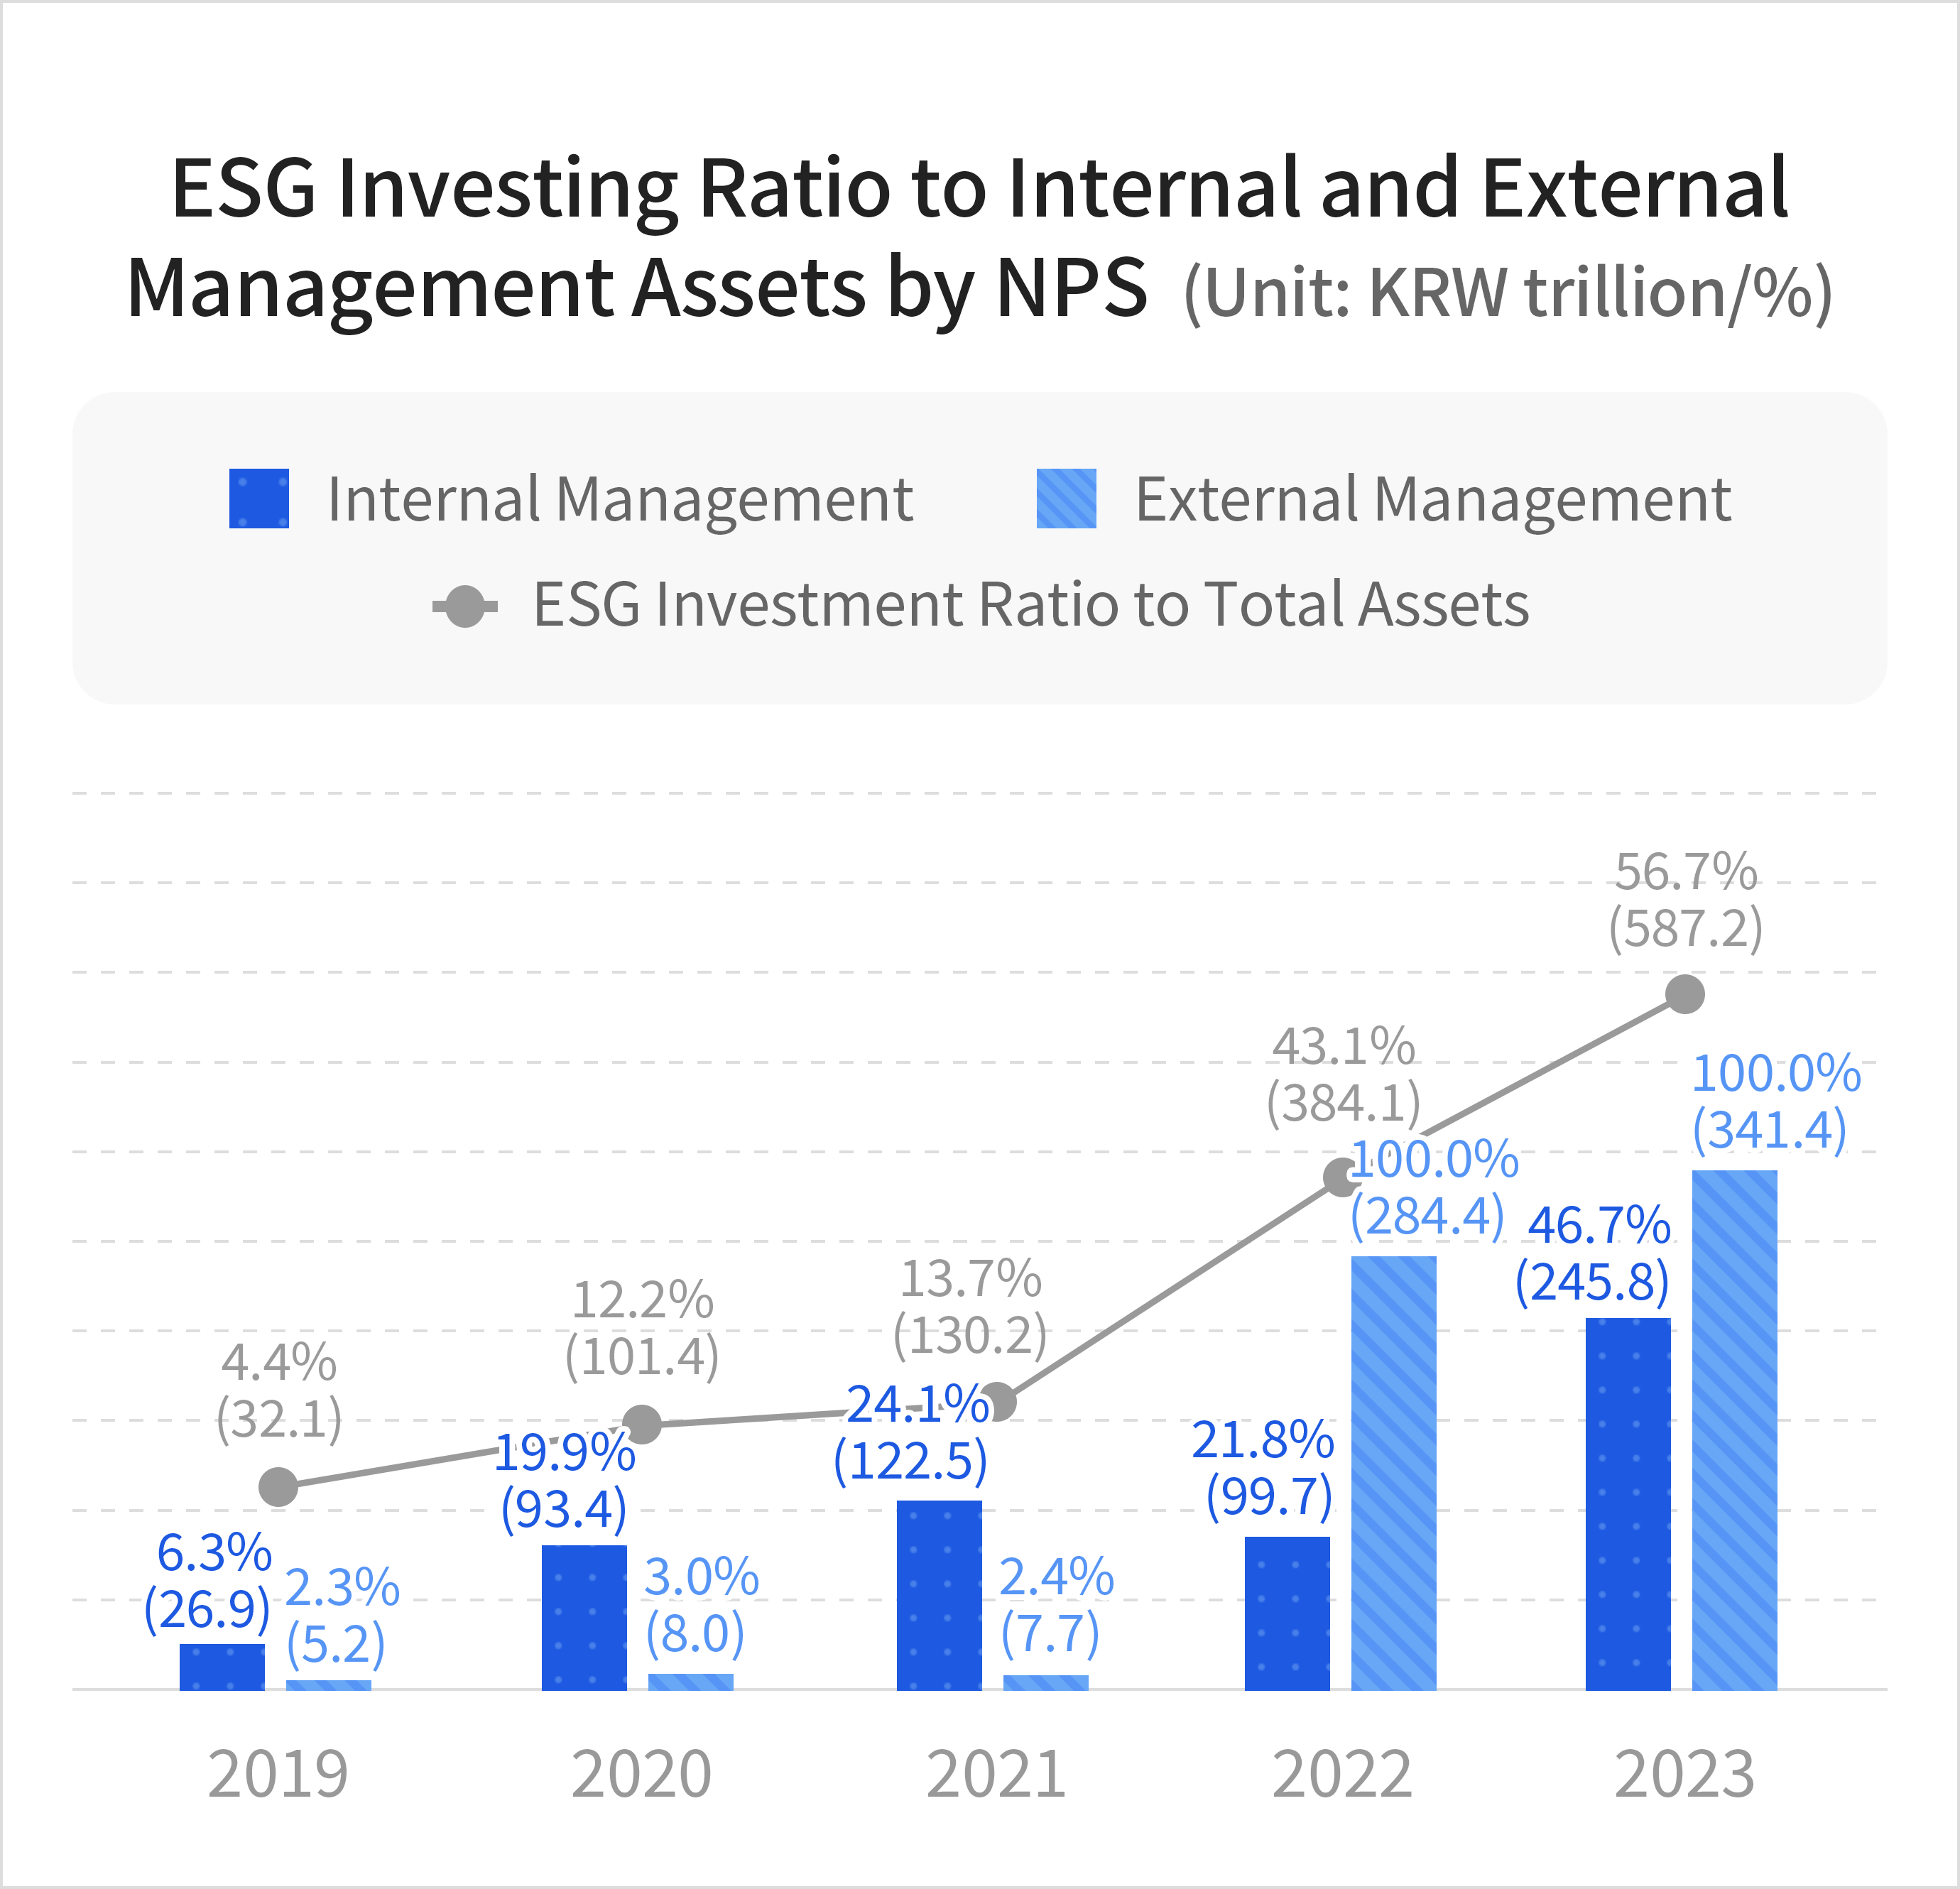
The National Pension Service (NPS) recorded KRW 587.2 trillion in ESG investments in 2023, representing a 52.9% year-on-year increase.This expansion reflects the implementation of the ESG Integration Policy, introduced under the Plan to Facilitate Responsible Investment approved by the NPS in 2019. Consequently, the share of responsible investment in the NPS’s total assets under management has continued to rise—13.7% in 2021, 43.1% in 2022, and 56.7% in 2023.
 Source: KoSIF(Korea Sustainability Investing Forum), Representative Byeong-deok Min's office